
We all have heard that lean is all about waste (or muda) elimination. Muda is any activity that does not add value. Lean methodology requires eliminating all such wasteful activities. Almost every organization that implements Lean talks about waste elimination.
Yes, removing waste (muda) is the most important aspect of Lean implementation. However, equally important are Muri and Mura. Actually Muda, Muri and Mura work together in a Lean enterprise.
So what is Muri and Mura?
Muri is pushing people or machines over the limit causing breakdown or defects.
Mura is unevenness in production due to fluctuations causing irregularities in production volumes. Fluctuations could be external or internal to the enterprise. External fluctuation is due to variation in customer demand whereas internal fluctuation is due to machine downtime, missing parts or people required to operate machines or defects.
Lean implementation requires a balance between Muri and Mura to remove Muda.
Have you thought about Muri and Mura in your lean implementation? How do you balance overburdening people/equipment and production irregularities to remove waste?
Write to us at info@sybeq.com about your lean journey.
Saturday, July 31, 2010

Tuesday, July 13, 2010
To Err is Human
'To Err is Human, to forgive divine' a famous quote by Alexander Pope considers the underlying truth about human nature that it is human to make mistakes but it is extraordinary to forgive the mistakes.
In today's world, it is necessary to understand the importance of this quotation because nothing or no one should assume to be perfect. If there are humans working mistakes are bound to happen. We just have to design systems that can handle these mistakes and ensure mistakes are caught and corrected before they go to customers. Error Proofing techniques provide the necessary tools for catching mistakes.
There are two types of approaches for error proofing - Warning and control.
Let's understand the difference between the two error proofing approahes using a simple example.
Microsoft word catches grammatical mistakes and indicates them by underlining the sentence. It also suggests changes by providing examples. This is an example of the warning approach.
Word finds and fixes spelling mistakes in a document right away. This is the control approach. Some folks don't like this feature in Word but I love it as it helps me in two ways. 1. I don't have to remember spelling of difficult words 2. I don't have to worry about my document have spelling errors.
Today the industry uses simple poka yoke devices to sophisticated systems to error proof the systems used by front line staff. The article Errors and Mistake Proofing explains this topic in detail.
Do you use poka yokes in your process? What type of error proofing approach do you use? We would love to hear from you. Just drop us a line at info@sybeq.com.
In today's world, it is necessary to understand the importance of this quotation because nothing or no one should assume to be perfect. If there are humans working mistakes are bound to happen. We just have to design systems that can handle these mistakes and ensure mistakes are caught and corrected before they go to customers. Error Proofing techniques provide the necessary tools for catching mistakes.
There are two types of approaches for error proofing - Warning and control.
Let's understand the difference between the two error proofing approahes using a simple example.
Microsoft word catches grammatical mistakes and indicates them by underlining the sentence. It also suggests changes by providing examples. This is an example of the warning approach.
Word finds and fixes spelling mistakes in a document right away. This is the control approach. Some folks don't like this feature in Word but I love it as it helps me in two ways. 1. I don't have to remember spelling of difficult words 2. I don't have to worry about my document have spelling errors.
Today the industry uses simple poka yoke devices to sophisticated systems to error proof the systems used by front line staff. The article Errors and Mistake Proofing explains this topic in detail.
Do you use poka yokes in your process? What type of error proofing approach do you use? We would love to hear from you. Just drop us a line at info@sybeq.com.
Wednesday, May 26, 2010
What process variation component do Cp, Cpk capture?
Cp and Cpk account for within subgroup variation only. This can be seen from the formulae used for the calculations…


In the above formulae process sigma is calculated using the formula given below:

where
Rbar is the average range of the total subgroups
d2 is a statistical constant based on the subgroup size
R or Range is the difference between maximum and minimum of the readings within a subgroup i.e. it accounts for the variation within subgroup.
Thus Cp, Cpk account for within subgroup variation and do not consider subgroup drift in the data.
To find capability of processes considering within subgroup variation as well as subgroup drift, use the Pp, Ppk indices.
How do you measure process capability? What indices do you use?


In the above formulae process sigma is calculated using the formula given below:

where
Rbar is the average range of the total subgroups
d2 is a statistical constant based on the subgroup size
R or Range is the difference between maximum and minimum of the readings within a subgroup i.e. it accounts for the variation within subgroup.
Thus Cp, Cpk account for within subgroup variation and do not consider subgroup drift in the data.
To find capability of processes considering within subgroup variation as well as subgroup drift, use the Pp, Ppk indices.
How do you measure process capability? What indices do you use?
Wednesday, April 28, 2010
Can Cpk be negative?
Yes, Cpk can be negative. Some quality folks find this hard to believe. In the real world when a negative Cpk appears most people try to check and recheck their calculations or the underlying data. But Cpk can be negative. Let’s try to prove it with 2 scenarios.
Cpk is calculated using the formula…

So we think about this formula, Cpk is the minimum distance of the process average from either specification limits.
Scenario 1
Consider a process as shown in figure 1. The process average is closest to the Lower Specification limit.
In this case, since process average is less than LSL, Cpk is negative.
The area of the histogram or distribution curve in red indicates parts that are below the Lower spec limit. All these parts are rejected.
Scenario 2
Consider another process as shown in figure 2. The process average is closest to the Upper Specification limit. In this case as process average is greater than USL, Cpk in this case is also negative.

The entire area under the distribution curve is red i.e. all parts are rejects as they are above the Upper spec limit.
What does a negative Cpk indicate?
As seen from the examples above, a negative Cpk indicates that the process average is outside the specification limits. Most of the readings are outside the specifications i.e. they are rejects.
Have you come across a negative Cpk? What did you think about it?
Cpk is calculated using the formula…
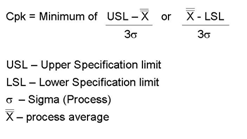
So we think about this formula, Cpk is the minimum distance of the process average from either specification limits.
Scenario 1

Consider a process as shown in figure 1. The process average is closest to the Lower Specification limit.
In this case, since process average is less than LSL, Cpk is negative.
The area of the histogram or distribution curve in red indicates parts that are below the Lower spec limit. All these parts are rejected.
Scenario 2
Consider another process as shown in figure 2. The process average is closest to the Upper Specification limit. In this case as process average is greater than USL, Cpk in this case is also negative.

The entire area under the distribution curve is red i.e. all parts are rejects as they are above the Upper spec limit.
What does a negative Cpk indicate?
As seen from the examples above, a negative Cpk indicates that the process average is outside the specification limits. Most of the readings are outside the specifications i.e. they are rejects.
Have you come across a negative Cpk? What did you think about it?
Monday, April 19, 2010
Measure Cpk only for stable processes
Cpk and other capability indices should be calculated for stable processes only. This is a critical requirement for calculating capability indices. Sadly, it is the most ignored fact in the real world.
What is a stable process?
A process that does not have any special causes present is a stable process. Such a process has inherent variation due to common causes only. The control chart for a stable process has no 'Out of control' points.
Why is stability important for Capability studies?
The capability indices are designed to determine how capable an ongoing process is for consistently delivering product within customer specifications given the natural variation of the process.
Ongoing processes should typically have only common cause variation i.e. the process is statistically stable.
When assignable causes come into play, the process becomes unstable. Now the control chart has out of control points that need to be watched closely and removed as soon as possible.
When processes are unstable, it is recommended to use performance indices like Pp and Ppk.
For more information on capability indices, please read our White Paper Use of different capability indices.
What is a stable process?
A process that does not have any special causes present is a stable process. Such a process has inherent variation due to common causes only. The control chart for a stable process has no 'Out of control' points.
Why is stability important for Capability studies?
The capability indices are designed to determine how capable an ongoing process is for consistently delivering product within customer specifications given the natural variation of the process.
Ongoing processes should typically have only common cause variation i.e. the process is statistically stable.
When assignable causes come into play, the process becomes unstable. Now the control chart has out of control points that need to be watched closely and removed as soon as possible.
When processes are unstable, it is recommended to use performance indices like Pp and Ppk.
For more information on capability indices, please read our White Paper Use of different capability indices.
Wednesday, March 31, 2010
RFID for product safety and security
Traceability of food products plays a vital role in ensuring food safety and security. Tracking the food products throughout the supply chain is necessary.
Right from the ingredient suppliers through food manufacturing plants to the distribution and retail to the final consumer, food products need to be tracked.
Traceability improves reliablility and safety of food products. In the event of food related contanimation, the source of the problem has to be traced and tracked back to manufacturer or the ingredient suppliers in a small period of time.
RFID Or Radio Frequency Identification are used to track products throughout the supply chain. Using radio waves, these radio frequency (RF) tags help identify and track products. Just like any other product, RFID helps track food products too.
It offers higher security as products move through the supply chain.
ISO recently released a new standard ISO 17367:2009 for the use of RFID for supply chain applications. Using the RFID technology, the standard aims to provide higher level of product security worldwide enabling efficient exchange of goods in international trade. This standard can be applied in several industry sectors using RFID technology.
Right from the ingredient suppliers through food manufacturing plants to the distribution and retail to the final consumer, food products need to be tracked.
Traceability improves reliablility and safety of food products. In the event of food related contanimation, the source of the problem has to be traced and tracked back to manufacturer or the ingredient suppliers in a small period of time.
RFID Or Radio Frequency Identification are used to track products throughout the supply chain. Using radio waves, these radio frequency (RF) tags help identify and track products. Just like any other product, RFID helps track food products too.
It offers higher security as products move through the supply chain.
ISO recently released a new standard ISO 17367:2009 for the use of RFID for supply chain applications. Using the RFID technology, the standard aims to provide higher level of product security worldwide enabling efficient exchange of goods in international trade. This standard can be applied in several industry sectors using RFID technology.
Monday, March 15, 2010
Role of Sigma in Cpk and Ppk calculations
Cpk and Ppk are calculated using the same formula.
So what’s the difference between the two?
The difference between Cpk and Ppk is the way sigma is estimated.
For Cpk, sigma is estimated using the formula…
Rbar/d2 for Xbar-R chart where Rbar is the average Range and d2 is a statistical constant
Sbar/c4 for Xbar-S chart where Sbar is the average standard deviation and c4 is a statistical constant
For Ppk, sigma is estimated using the formula

Where
X – Individual reading

- Process average
n – Sample size
So why use two separate indices?
Cpk and Ppk are designed for use under specific conditions.
Sigma used in the Cpk calculation explains inherent variation in the process which is caused by common causes. The control chart for such a process would be statistically stable.
On the other hand, sigma used in Ppk calculation explains the total variation caused by common as well as special causes. Control charts for this process would have points out of control i.e. the process is unstable.
New process design or pre production (pilot) runs for new products would typically have special and common causes present. Ppk is used for determining capability of such processes.
So what’s the difference between the two?
The difference between Cpk and Ppk is the way sigma is estimated.
For Cpk, sigma is estimated using the formula…
Rbar/d2 for Xbar-R chart where Rbar is the average Range and d2 is a statistical constant
Sbar/c4 for Xbar-S chart where Sbar is the average standard deviation and c4 is a statistical constant
For Ppk, sigma is estimated using the formula

Where
X – Individual reading

- Process average
n – Sample size
So why use two separate indices?
Cpk and Ppk are designed for use under specific conditions.
Sigma used in the Cpk calculation explains inherent variation in the process which is caused by common causes. The control chart for such a process would be statistically stable.
On the other hand, sigma used in Ppk calculation explains the total variation caused by common as well as special causes. Control charts for this process would have points out of control i.e. the process is unstable.
New process design or pre production (pilot) runs for new products would typically have special and common causes present. Ppk is used for determining capability of such processes.
Subscribe to:
Posts (Atom)