Wednesday, May 26, 2010

What process variation component do Cp, Cpk capture?

Cp and Cpk account for within subgroup variation only. This can be seen from the formulae used for the calculations…


In the above formulae process sigma is calculated using the formula given below:


where
Rbar is the average range of the total subgroups
d2 is a statistical constant based on the subgroup size
R or Range is the difference between maximum and minimum of the readings within a subgroup i.e. it accounts for the variation within subgroup.

Thus Cp, Cpk account for within subgroup variation and do not consider subgroup drift in the data.
To find capability of processes considering within subgroup variation as well as subgroup drift, use the Pp, Ppk indices.

How do you measure process capability? What indices do you use?

Wednesday, April 28, 2010

Can Cpk be negative?

Yes, Cpk can be negative. Some quality folks find this hard to believe. In the real world when a negative Cpk appears most people try to check and recheck their calculations or the underlying data. But Cpk can be negative. Let’s try to prove it with 2 scenarios.

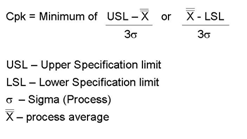
Cpk is calculated using the formula…


So we think about this formula, Cpk is the minimum distance of the process average from either specification limits.

Scenario 1
Consider a process as shown in figure 1. The process average is closest to the Lower Specification limit.
In this case, since process average is less than LSL, Cpk is negative.

The area of the histogram or distribution curve in red indicates parts that are below the Lower spec limit. All these parts are rejected.

Scenario 2
Consider another process as shown in figure 2. The process average is closest to the Upper Specification limit. In this case as process average is greater than USL, Cpk in this case is also negative.

The entire area under the distribution curve is red i.e. all parts are rejects as they are above the Upper spec limit.

What does a negative Cpk indicate?
As seen from the examples above, a negative Cpk indicates that the process average is outside the specification limits. Most of the readings are outside the specifications i.e. they are rejects.

Have you come across a negative Cpk? What did you think about it?

Monday, April 19, 2010

Measure Cpk only for stable processes

Cpk and other capability indices should be calculated for stable processes only. This is a critical requirement for calculating capability indices. Sadly, it is the most ignored fact in the real world.

What is a stable process?
A process that does not have any special causes present is a stable process. Such a process has inherent variation due to common causes only. The control chart for a stable process has no 'Out of control' points.

Why is stability important for Capability studies?
The capability indices are designed to determine how capable an ongoing process is for consistently delivering product within customer specifications given the natural variation of the process.
Ongoing processes should typically have only common cause variation i.e. the process is statistically stable.
When assignable causes come into play, the process becomes unstable. Now the control chart has out of control points that need to be watched closely and removed as soon as possible.

When processes are unstable, it is recommended to use performance indices like Pp and Ppk.

For more information on capability indices, please read our White Paper Use of different capability indices.

Wednesday, March 31, 2010

RFID for product safety and security

Traceability of food products plays a vital role in ensuring food safety and security. Tracking the food products throughout the supply chain is necessary.
Right from the ingredient suppliers through food manufacturing plants to the distribution and retail to the final consumer, food products need to be tracked.

Traceability improves reliablility and safety of food products. In the event of food related contanimation, the source of the problem has to be traced and tracked back to manufacturer or the ingredient suppliers in a small period of time.

RFID Or Radio Frequency Identification are used to track products throughout the supply chain. Using radio waves, these radio frequency (RF) tags help identify and track products. Just like any other product, RFID helps track food products too.
It offers higher security as products move through the supply chain.

ISO recently released a new standard ISO 17367:2009 for the use of RFID for supply chain applications. Using the RFID technology, the standard aims to provide higher level of product security worldwide enabling efficient exchange of goods in international trade. This standard can be applied in several industry sectors using RFID technology.

Monday, March 15, 2010

Role of Sigma in Cpk and Ppk calculations

Cpk and Ppk are calculated using the same formula.
So what’s the difference between the two?
The difference between Cpk and Ppk is the way sigma is estimated.

For Cpk, sigma is estimated using the formula…
Rbar/d2 for Xbar-R chart where Rbar is the average Range and d2 is a statistical constant
Sbar/c4 for Xbar-S chart where Sbar is the average standard deviation and c4 is a statistical constant

For Ppk, sigma is estimated using the formula


Where
X – Individual reading

- Process average

n – Sample size

So why use two separate indices?
Cpk and Ppk are designed for use under specific conditions.

Sigma used in the Cpk calculation explains inherent variation in the process which is caused by common causes. The control chart for such a process would be statistically stable.

On the other hand, sigma used in Ppk calculation explains the total variation caused by common as well as special causes. Control charts for this process would have points out of control i.e. the process is unstable.
New process design or pre production (pilot) runs for new products would typically have special and common causes present. Ppk is used for determining capability of such processes.

Saturday, February 20, 2010

Food Quality and Safety go hand in hand

The food and beverage industry has to deliver high quality product that satisfy the consumer needs like any other industry. In addition the food and beverage industry has to comply with the safety and regulatory requirements. Food safety and regulatory compliance are some of the key elements that food and beverage manufacturers track to prevent non compliance issues or recalls.

High quality of the food products in manufacturing plants usually results in high safety. Manufacturing plants that pay close attention to quality of the food products they make typically comply with the safety and regulatory requirements too.
Such plants will typically monitor the food products for regulatory compliance.
Regulatory checks like MAV or net weight/volume of the food products are monitored in real time. Actions are initiated as soon as violations are uncovered.

Let's think about it in using a simulation food plant X that makes ice cream.
Company X is operating at small rejection levels or high quality in production. They conduct the metal detection and other safety checks as part of their routine checks everyday.
Regulatory checks for MAV and net weight violations are tracked and controlled using automated systems.
Mistake proofing is in place using poka yoke devices. There are poka yokes that check box labels, match the box to the correct lid, check ingredients among many other checks.
Poka yoke devices themselves are regularly validated for accuracy.
Everyone in the plant considers quality and safety to be their responsibility.
Ice cream from this plant is high quality which is good for the company and safe for consumers which ultimately results in customer satisfaction.

Safe Quality food program from SQFI (Safe Quality Food Institute) is a food safety program. This program has different levels that start with basic food safety going through certified HACCP food safety plans finally requiring implementation of a comprehensive Quality Management System. Food safety is the primary focus of this program and quality being the secondary requirement. Even though food quality comes after safety, it plays an important role. Safe food products will usually have high quality in the manufacturing plants.

Wednesday, February 10, 2010

So much information, so little time!

Consumers shopping for food are busy and have very little time to read through all the information on food labels. Most consumers look for the best deal and quickly look at symbols before they purchase food products. Very few take the time to read nutrition facts or ingredient information on labels. Many consumers even misinterpret the symbols used on food products.

Food labels that use words like “organic”, “all natural” imply that the food is healthy. There is a lot of debate on the two terms natural and organic. Is natural the same as organic? Different? Is organic better than natural food? Does natural imply that there are no artificial ingredients or has minimum/no processing?

This leaves the poor consumer wondering how to make sense of these labels on food packages. Some even think if they made the right choice while shopping for food items. The consumer can always turn to the food and drug administration (FDA) for assistance.
FDA has provided food labeling guidelines and the requirements for claiming the food to be ‘healthy’ (please see N49 on this page).