
In the last post we talked about the different questions lean pratitioners have about implementing Value Stream Mapping.
The question of where to begin mapping value streams actually requires understanding the definition of value stream.
Lean practitioners need to have the ability to clearly identify and define a value stream.
A Value Stream is a stream of activities required to satify a customer need. The value stream starts with the customer who may be external or internal and ends where it is has a logical end. What this means is...
1. Start with the customer. First, define who is the customer and what do they need.
2. With this defined, start Walking the value stream backwards one step at a time.
3. Stop wherever it seems to be a logical stopping point.
While doing the above steps do not restrict the value stream by functions or departments. This is because a value stream may cross multiple departments. The ultimate goal of value Stream Mapping is to map how the stream works starting with the customer first and ends where it is a logical stopping point.
Do you face the challenge of where to begin mapping value streams? Tell us about your VSM implementation. Email: info@sybeq.com
Thursday, September 23, 2010

Monday, August 30, 2010
How to Map Value Streams in the real world?
Over the years we have heard many questions about Value Stream Mapping from people who are new to VSM as well those who have used VSM before.
Questions like these are not uncommon...
Where to begin mapping the Value Stream?
How many Value Stream Maps should be created to begin Lean implementation?
What about overlapping Value Streams?
How to handle parallel Value Streams?
How much information should be captured on the Value Stream Maps?
We will try to address the above questions in the next few posts.
In this post we would like to address the reason for the above questions. The primary reason for VSM questions is the way most people think. In Lean thinking, Value is defined by the customer and it flows across multiple functions. The focus of VSM is to capture the flow of material and information across the functions by actually walking the stream. Additional information like process and wait time along with information about the person working at the process step is also captured on the Value Stream Map. Overall lead time can also be calculated and displayed on the map.
Most of the confusion around VSM is because people think about process maps or about the function/department they work in.
This is because most organizations still think about department efficiency or process steps. Value Stream Mapping crosses multiple functions in the organization.
The steps to map Value Streams is explained in the article How to Map Value Streams?on our website.
Questions like these are not uncommon...
Where to begin mapping the Value Stream?
How many Value Stream Maps should be created to begin Lean implementation?
What about overlapping Value Streams?
How to handle parallel Value Streams?
How much information should be captured on the Value Stream Maps?
We will try to address the above questions in the next few posts.
In this post we would like to address the reason for the above questions. The primary reason for VSM questions is the way most people think. In Lean thinking, Value is defined by the customer and it flows across multiple functions. The focus of VSM is to capture the flow of material and information across the functions by actually walking the stream. Additional information like process and wait time along with information about the person working at the process step is also captured on the Value Stream Map. Overall lead time can also be calculated and displayed on the map.
Most of the confusion around VSM is because people think about process maps or about the function/department they work in.
This is because most organizations still think about department efficiency or process steps. Value Stream Mapping crosses multiple functions in the organization.
The steps to map Value Streams is explained in the article How to Map Value Streams?on our website.
Saturday, August 21, 2010
Becoming lean without reducing mura
In the last post we covered the importance of balancing muri and mura to remove muda (waste) in the process. But what do you do when mura or unevenness in production cannot be controlled?
We often hear manufacturers say that production volumes change everyday sometimes every hour as the customer demand is constantly changing. In today's world the business has to do what the customer wants or be prepared to face consequences of lost sales, lost customer etc.
Most customers today demand what they need when they need it. Businesses that can cater to this need survive.
So how does the business remain lean inspite of these flucutations in production volume?
The business can be ready for such fluctuations by accounting for it beforehand. The manufacturer can plan for this by taking 3 simple steps...
1. Carry a small finished goods inventory to satisfy the customer demand in case the demand suddenly rises. The question becomes how much? Carry enough inventory to allow production to run smoothly without stressing the plant people and equipment. Carrying too much inventory is a form of waste and not recommended in a lean system. Too much inventory will hide problems and tie up cash in form of product cost, floor space occupied to store the product etc.
2. Plan for producing quantities that do not push the plant over limits. This will allow the plant to pace production so that the total cycle time is met. Process steps can be run below takt time to meet customer demand.
3. Leadership should think ahead with the foresightedness of planning for leveling the production load so that customer demand is met.
Do you experience irregularities in production? How do you manage such production irregularities and being lean at the same time?
Write to us at info@sybeq.com about your experiences and challenges in your lean journey.
We often hear manufacturers say that production volumes change everyday sometimes every hour as the customer demand is constantly changing. In today's world the business has to do what the customer wants or be prepared to face consequences of lost sales, lost customer etc.
Most customers today demand what they need when they need it. Businesses that can cater to this need survive.
So how does the business remain lean inspite of these flucutations in production volume?
The business can be ready for such fluctuations by accounting for it beforehand. The manufacturer can plan for this by taking 3 simple steps...
1. Carry a small finished goods inventory to satisfy the customer demand in case the demand suddenly rises. The question becomes how much? Carry enough inventory to allow production to run smoothly without stressing the plant people and equipment. Carrying too much inventory is a form of waste and not recommended in a lean system. Too much inventory will hide problems and tie up cash in form of product cost, floor space occupied to store the product etc.
2. Plan for producing quantities that do not push the plant over limits. This will allow the plant to pace production so that the total cycle time is met. Process steps can be run below takt time to meet customer demand.
3. Leadership should think ahead with the foresightedness of planning for leveling the production load so that customer demand is met.
Do you experience irregularities in production? How do you manage such production irregularities and being lean at the same time?
Write to us at info@sybeq.com about your experiences and challenges in your lean journey.
Saturday, July 31, 2010
Lean System requires eliminating Muda, Muri, Mura
We all have heard that lean is all about waste (or muda) elimination. Muda is any activity that does not add value. Lean methodology requires eliminating all such wasteful activities. Almost every organization that implements Lean talks about waste elimination.
Yes, removing waste (muda) is the most important aspect of Lean implementation. However, equally important are Muri and Mura. Actually Muda, Muri and Mura work together in a Lean enterprise.
So what is Muri and Mura?
Muri is pushing people or machines over the limit causing breakdown or defects.
Mura is unevenness in production due to fluctuations causing irregularities in production volumes. Fluctuations could be external or internal to the enterprise. External fluctuation is due to variation in customer demand whereas internal fluctuation is due to machine downtime, missing parts or people required to operate machines or defects.
Lean implementation requires a balance between Muri and Mura to remove Muda.
Have you thought about Muri and Mura in your lean implementation? How do you balance overburdening people/equipment and production irregularities to remove waste?
Write to us at info@sybeq.com about your lean journey.
Yes, removing waste (muda) is the most important aspect of Lean implementation. However, equally important are Muri and Mura. Actually Muda, Muri and Mura work together in a Lean enterprise.
So what is Muri and Mura?
Muri is pushing people or machines over the limit causing breakdown or defects.
Mura is unevenness in production due to fluctuations causing irregularities in production volumes. Fluctuations could be external or internal to the enterprise. External fluctuation is due to variation in customer demand whereas internal fluctuation is due to machine downtime, missing parts or people required to operate machines or defects.
Lean implementation requires a balance between Muri and Mura to remove Muda.
Have you thought about Muri and Mura in your lean implementation? How do you balance overburdening people/equipment and production irregularities to remove waste?
Write to us at info@sybeq.com about your lean journey.
Tuesday, July 13, 2010
To Err is Human
'To Err is Human, to forgive divine' a famous quote by Alexander Pope considers the underlying truth about human nature that it is human to make mistakes but it is extraordinary to forgive the mistakes.
In today's world, it is necessary to understand the importance of this quotation because nothing or no one should assume to be perfect. If there are humans working mistakes are bound to happen. We just have to design systems that can handle these mistakes and ensure mistakes are caught and corrected before they go to customers. Error Proofing techniques provide the necessary tools for catching mistakes.
There are two types of approaches for error proofing - Warning and control.
Let's understand the difference between the two error proofing approahes using a simple example.
Microsoft word catches grammatical mistakes and indicates them by underlining the sentence. It also suggests changes by providing examples. This is an example of the warning approach.
Word finds and fixes spelling mistakes in a document right away. This is the control approach. Some folks don't like this feature in Word but I love it as it helps me in two ways. 1. I don't have to remember spelling of difficult words 2. I don't have to worry about my document have spelling errors.
Today the industry uses simple poka yoke devices to sophisticated systems to error proof the systems used by front line staff. The article Errors and Mistake Proofing explains this topic in detail.
Do you use poka yokes in your process? What type of error proofing approach do you use? We would love to hear from you. Just drop us a line at info@sybeq.com.
In today's world, it is necessary to understand the importance of this quotation because nothing or no one should assume to be perfect. If there are humans working mistakes are bound to happen. We just have to design systems that can handle these mistakes and ensure mistakes are caught and corrected before they go to customers. Error Proofing techniques provide the necessary tools for catching mistakes.
There are two types of approaches for error proofing - Warning and control.
Let's understand the difference between the two error proofing approahes using a simple example.
Microsoft word catches grammatical mistakes and indicates them by underlining the sentence. It also suggests changes by providing examples. This is an example of the warning approach.
Word finds and fixes spelling mistakes in a document right away. This is the control approach. Some folks don't like this feature in Word but I love it as it helps me in two ways. 1. I don't have to remember spelling of difficult words 2. I don't have to worry about my document have spelling errors.
Today the industry uses simple poka yoke devices to sophisticated systems to error proof the systems used by front line staff. The article Errors and Mistake Proofing explains this topic in detail.
Do you use poka yokes in your process? What type of error proofing approach do you use? We would love to hear from you. Just drop us a line at info@sybeq.com.
Wednesday, May 26, 2010
What process variation component do Cp, Cpk capture?
Cp and Cpk account for within subgroup variation only. This can be seen from the formulae used for the calculations…


In the above formulae process sigma is calculated using the formula given below:

where
Rbar is the average range of the total subgroups
d2 is a statistical constant based on the subgroup size
R or Range is the difference between maximum and minimum of the readings within a subgroup i.e. it accounts for the variation within subgroup.
Thus Cp, Cpk account for within subgroup variation and do not consider subgroup drift in the data.
To find capability of processes considering within subgroup variation as well as subgroup drift, use the Pp, Ppk indices.
How do you measure process capability? What indices do you use?


In the above formulae process sigma is calculated using the formula given below:

where
Rbar is the average range of the total subgroups
d2 is a statistical constant based on the subgroup size
R or Range is the difference between maximum and minimum of the readings within a subgroup i.e. it accounts for the variation within subgroup.
Thus Cp, Cpk account for within subgroup variation and do not consider subgroup drift in the data.
To find capability of processes considering within subgroup variation as well as subgroup drift, use the Pp, Ppk indices.
How do you measure process capability? What indices do you use?
Wednesday, April 28, 2010
Can Cpk be negative?
Yes, Cpk can be negative. Some quality folks find this hard to believe. In the real world when a negative Cpk appears most people try to check and recheck their calculations or the underlying data. But Cpk can be negative. Let’s try to prove it with 2 scenarios.
Cpk is calculated using the formula…

So we think about this formula, Cpk is the minimum distance of the process average from either specification limits.
Scenario 1
Consider a process as shown in figure 1. The process average is closest to the Lower Specification limit.
In this case, since process average is less than LSL, Cpk is negative.
The area of the histogram or distribution curve in red indicates parts that are below the Lower spec limit. All these parts are rejected.
Scenario 2
Consider another process as shown in figure 2. The process average is closest to the Upper Specification limit. In this case as process average is greater than USL, Cpk in this case is also negative.

The entire area under the distribution curve is red i.e. all parts are rejects as they are above the Upper spec limit.
What does a negative Cpk indicate?
As seen from the examples above, a negative Cpk indicates that the process average is outside the specification limits. Most of the readings are outside the specifications i.e. they are rejects.
Have you come across a negative Cpk? What did you think about it?
Cpk is calculated using the formula…
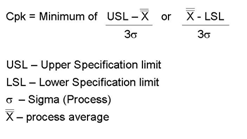
So we think about this formula, Cpk is the minimum distance of the process average from either specification limits.
Scenario 1

Consider a process as shown in figure 1. The process average is closest to the Lower Specification limit.
In this case, since process average is less than LSL, Cpk is negative.
The area of the histogram or distribution curve in red indicates parts that are below the Lower spec limit. All these parts are rejected.
Scenario 2
Consider another process as shown in figure 2. The process average is closest to the Upper Specification limit. In this case as process average is greater than USL, Cpk in this case is also negative.

The entire area under the distribution curve is red i.e. all parts are rejects as they are above the Upper spec limit.
What does a negative Cpk indicate?
As seen from the examples above, a negative Cpk indicates that the process average is outside the specification limits. Most of the readings are outside the specifications i.e. they are rejects.
Have you come across a negative Cpk? What did you think about it?
Subscribe to:
Posts (Atom)