The concept of load leveling requires careful analysis of production volumes and schedules so that production makes same quantity of parts both by volume and product mix everyday.
The steps for leveling the load include:
1. Take the total volume of customer orders in a period by product type.
2. Determine the quantity of parts by product so that the same volume needs to be produced by product type.
3. Analyze the time required to make a part by product type and time required for changeover.
4. Plan a stable production schedule so that plant floor doesn't have to deal with fluctuations.
The goal of leveling the load is planning to work at a consistent pace in production making a mix of parts so that the equipment and people are working at the same pace without stopping or being stressed.
Because of this production is not rushed for deliveries giving production folks enough time to implement standard work and avoid errors.
The key to find the mixed model that works for your process/line. Once the mixed model is determined, production has to make the same quantity, mix of products and repeat it everyday.
Load leveling presents many challenges:
- The concept of load leveling is counter intuitive to batch manufacturing where the focus is to run a batch of same product as long as you can and run it efficiently. Load leveling on the other hand says it is okay to changeover from one product to another. In fact load leveling encourages multiple changeovers in a day or a shift.
- Due to the mixed model approach, there may be some amount of finished goods inventory when implementing load leveling. This may make some Lean experts unhappy as they view inventory as waste.
Ultimately it is important to look at the risk of carrying some inventory to satisfy customer demand or make the customer wait for the product they need.
- Load leveling won't be successful without having quick changeovers i.e. reducing changeover time.
Taiichi Ohno explained this with the story of the race between the tortoise and the rabbit. The slow and steady tortoise wins the race. Ohno said it is desirable to be slower but consistent tortoise as it causes less waste than the speedy rabbit who races then stops to rest.
Thursday, December 30, 2010
Thursday, December 2, 2010
Load leveling is key to becoming lean
The last few posts on our blog focussed on Value Stream Mapping and other lean tools used for waste removal.
Removing waste is the main focus of lean manufacturing.
Value Stream Maps allow lean practitioners to get a true picture of activities done in a process. These maps make waste visible so that it can be removed.
Waste can be removed using lean tools.
In today's world, production volumes change based on customer demand and customer demand fluctuates. Plants practicing Just In Time start producing only when the customer signals for parts. Plants cannot possibly respond to such high variations in demand. So they carry some buffer stock for finished goods.
There may be raw material inventory or WIP necessary to prepare for such demand fluctuations.
Carrying enough inventory is the key to meet customer demands. If plants carry too much they are creating waste and hiding problems.
That is why it is important to level the load so that plants produce at a uniform pace without causing stress to equipment or people. Stressing the equipment could cause breakdowns and stressing people may cause errors or accidents.
But what is load leveling?
Load Leveling is the process of producing the same quantity and mix of parts without responding to every fluctuation in customer demand. This reduces unnecessary stress on equipment or people working in the plant resulting in fewer breakdowns and errors.
The question is how to level the load?
We will try to answer this in our next post.
Thursday, November 18, 2010
VSM makes problems visible
Lean principles talk about making problems visible so that they can be solved. Value Stream Mapping focuses on charting activities as they happen in the process. The main goal of VSM is to make problems/waste visible.
But what happens next is equally important. Problems need to be acted upon. Lean practitioners need to identify what how to resolve problems or remove waste.
The following approach may help practitioners with problem solving:
1. Identify the list of problems in your area.
2. Measure the impact of the problem on external and internal customers and the organization's bottomline.
3. Prioritize by impact of the problem.
4. Undertake root cause analysis using 5 Why analysis or cause and effect diagram.
5. Identify root causes and corrective actions that can be implemented.
Problems are everywhere. Sometimes very prominent staring you in your face and other times hidden. The key is to find them as soon as they appear and fix them.
This actually resonates with what Philip Crosby said "It isn't what you find; it's what you do about what you find".
What problem solving technique do you use in your workplace? How do you identify problems? Send us your comments at info@sybeq.com.
Thursday, October 28, 2010
Using a Pull system not so Lean
One of the key lean tools is implementing kanban which uses the pull system. Lean is all about moving away from the traditional push system toward the pull system. In a lean enterprise, it is always recommended not to push parts or information to the next process step. The focus is to pull parts when the downstream process step requests for parts/information.
Some Lean practitioners rave about the pull systems they have implemented. However experienced Lean practitioners don't give much credit to pull systems. This is because...
1. Lean is all about removing waste.
2. When waste cannot be removed, there is inventory in process or at the final stage. This inventory needs to be managed in the best way possible. In such situations, a pull system is used.
Implementing the pull system is an indication that waste is still present. This is a good starting point for reducing waste but it is definitely the final goal. The Lean implementation team should not stop at implementing the pull system. In fact the team should continuously work toward removing waste altogether and not use the pull system.
As rightly said by Jeffery Liker in the book Toyota Way "Flow where you can, pull where you must". The ultimate goal to make value flow as smoothly as possible.
Monday, October 11, 2010
Information on Value Stream Maps
Value Stream Maps are used to map the flow of information and material in the value stream. This generic statement explains the purpose the value stream maps.
But new users struggle with how much detail about the value stream should be captured on the VSM.
What should be captured?
How should this information be displayed on the map?
In this post we will try to answer these questions.
A value stream map is a picture of your value stream. It's purpose is to find what is happening now which will help identify waste in the value stream. Once waste becomes visible Lean tools can be applied to remove it.
The following information could be helpful if captured on a value stream map..
1. The layout of the area will become evident once the map is complete. The amount of distance between process steps or user motions at the step or the physical movement of material and information.
2. The amount of time required by the user to process a unit. For example time required to verify one insurance claim at the claims verification step.
3. The amount of wait time at the process step. Wait time could be people waiting for material/information (no parts or claims to process) or material/information waiting to get processed (Average wait time for raw material in the incoming warehouse or wait time for claims process to begin).
4. Total time per unit at each process step. This is the addition of processing and wait time per unit.
5. Total lead or throughput time for the entire value stream. This is the time needed to make a single part or process a single insurance claim.
6. Time for rework and repair activity. This information needs to be captured if rework/repair is being tracked as part of the value stream. If this is considered as another value stream this information can be left out.
7. Interruptions in the flow of value as reworked parts/claims get reintroduced at a specific step in the value stream.
What kind of information do you capture on Value Stream Maps?
Tuesday, September 28, 2010
VSM during early stages of Lean implementation
How many Value Stream Maps should be created at the start of Lean implementation?
We typically hear this question from...
1. Users who have recently learned the Value Stream Mapping tool
2. Organizations who are new to Lean implementation, just starting out on their lean journey
Start the Lean implementation with a few (say 2 to 3) value stream maps for processes that have the most non value adding activities (waste).
Why just 2 to 3?
Because of several reasons..
1. Creating Value Streams is a time consuming activity.
- Teams creating these maps have to walk the value stream and capture information
about material and information flows.
- Teams have to then create the current state map, identify waste and the Lean
tools they plan to use, create the future state map.
2. After creating the maps in the meeting room, now teams have to actually go and implement the Lean tools in the value stream. This is the most challenging part as this may take anywhere from a few days to few weeks. There are many aspects of the implementation like corporate culture, motivation level of people, management involvement, complexity of the process that could play a role.
3. Getting rid of all the waste in the process may require several cycles of going from the current to the future state. After all Lean is a journey of continuously removing waste.
How many value streams have you worked with? How many value streams did you start with when your organization was in early phases of Lean implementation?
Send us your questions or comments at info@Sybeq.com
Thursday, September 23, 2010
Where to begin mapping Value Streams?
In the last post we talked about the different questions lean pratitioners have about implementing Value Stream Mapping.
The question of where to begin mapping value streams actually requires understanding the definition of value stream.
Lean practitioners need to have the ability to clearly identify and define a value stream.
A Value Stream is a stream of activities required to satify a customer need. The value stream starts with the customer who may be external or internal and ends where it is has a logical end. What this means is...
1. Start with the customer. First, define who is the customer and what do they need.
2. With this defined, start Walking the value stream backwards one step at a time.
3. Stop wherever it seems to be a logical stopping point.
While doing the above steps do not restrict the value stream by functions or departments. This is because a value stream may cross multiple departments. The ultimate goal of value Stream Mapping is to map how the stream works starting with the customer first and ends where it is a logical stopping point.
Do you face the challenge of where to begin mapping value streams? Tell us about your VSM implementation. Email: info@sybeq.com
Monday, August 30, 2010
How to Map Value Streams in the real world?
Over the years we have heard many questions about Value Stream Mapping from people who are new to VSM as well those who have used VSM before.
Questions like these are not uncommon...
Where to begin mapping the Value Stream?
How many Value Stream Maps should be created to begin Lean implementation?
What about overlapping Value Streams?
How to handle parallel Value Streams?
How much information should be captured on the Value Stream Maps?
We will try to address the above questions in the next few posts.
In this post we would like to address the reason for the above questions. The primary reason for VSM questions is the way most people think. In Lean thinking, Value is defined by the customer and it flows across multiple functions. The focus of VSM is to capture the flow of material and information across the functions by actually walking the stream. Additional information like process and wait time along with information about the person working at the process step is also captured on the Value Stream Map. Overall lead time can also be calculated and displayed on the map.
Most of the confusion around VSM is because people think about process maps or about the function/department they work in.
This is because most organizations still think about department efficiency or process steps. Value Stream Mapping crosses multiple functions in the organization.
The steps to map Value Streams is explained in the article How to Map Value Streams?on our website.
Saturday, August 21, 2010
Becoming lean without reducing mura
In the last post we covered the importance of balancing muri and mura to remove muda (waste) in the process. But what do you do when mura or unevenness in production cannot be controlled?
We often hear manufacturers say that production volumes change everyday sometimes every hour as the customer demand is constantly changing. In today's world the business has to do what the customer wants or be prepared to face consequences of lost sales, lost customer etc.
Most customers today demand what they need when they need it. Businesses that can cater to this need survive.
So how does the business remain lean inspite of these flucutations in production volume?
The business can be ready for such fluctuations by accounting for it beforehand. The manufacturer can plan for this by taking 3 simple steps...
1. Carry a small finished goods inventory to satisfy the customer demand in case the demand suddenly rises. The question becomes how much? Carry enough inventory to allow production to run smoothly without stressing the plant people and equipment. Carrying too much inventory is a form of waste and not recommended in a lean system. Too much inventory will hide problems and tie up cash in form of product cost, floor space occupied to store the product etc.
2. Plan for producing quantities that do not push the plant over limits. This will allow the plant to pace production so that the total cycle time is met. Process steps can be run below takt time to meet customer demand.
3. Leadership should think ahead with the foresightedness of planning for leveling the production load so that customer demand is met.
Do you experience irregularities in production? How do you manage such production irregularities and being lean at the same time?
Write to us at info@sybeq.com about your experiences and challenges in your lean journey.
Saturday, July 31, 2010
Lean System requires eliminating Muda, Muri, Mura
We all have heard that lean is all about waste (or muda) elimination. Muda is any activity that does not add value. Lean methodology requires eliminating all such wasteful activities. Almost every organization that implements Lean talks about waste elimination.
Yes, removing waste (muda) is the most important aspect of Lean implementation. However, equally important are Muri and Mura. Actually Muda, Muri and Mura work together in a Lean enterprise.
So what is Muri and Mura?
Muri is pushing people or machines over the limit causing breakdown or defects.
Mura is unevenness in production due to fluctuations causing irregularities in production volumes. Fluctuations could be external or internal to the enterprise. External fluctuation is due to variation in customer demand whereas internal fluctuation is due to machine downtime, missing parts or people required to operate machines or defects.
Lean implementation requires a balance between Muri and Mura to remove Muda.
Have you thought about Muri and Mura in your lean implementation? How do you balance overburdening people/equipment and production irregularities to remove waste?
Write to us at info@sybeq.com about your lean journey.
Tuesday, July 13, 2010
To Err is Human
'To Err is Human, to forgive divine' a famous quote by Alexander Pope considers the underlying truth about human nature that it is human to make mistakes but it is extraordinary to forgive the mistakes.
In today's world, it is necessary to understand the importance of this quotation because nothing or no one should assume to be perfect. If there are humans working mistakes are bound to happen. We just have to design systems that can handle these mistakes and ensure mistakes are caught and corrected before they go to customers. Error Proofing techniques provide the necessary tools for catching mistakes.
There are two types of approaches for error proofing - Warning and control.
Let's understand the difference between the two error proofing approahes using a simple example.
Microsoft word catches grammatical mistakes and indicates them by underlining the sentence. It also suggests changes by providing examples. This is an example of the warning approach.
Word finds and fixes spelling mistakes in a document right away. This is the control approach. Some folks don't like this feature in Word but I love it as it helps me in two ways. 1. I don't have to remember spelling of difficult words 2. I don't have to worry about my document have spelling errors.
Today the industry uses simple poka yoke devices to sophisticated systems to error proof the systems used by front line staff. The article Errors and Mistake Proofing explains this topic in detail.
Do you use poka yokes in your process? What type of error proofing approach do you use? We would love to hear from you. Just drop us a line at info@sybeq.com.
Wednesday, May 26, 2010
What process variation component do Cp, Cpk capture?
Cp and Cpk account for within subgroup variation only. This can be seen from the formulae used for the calculations…


In the above formulae process sigma is calculated using the formula given below:

where
Rbar is the average range of the total subgroups
d2 is a statistical constant based on the subgroup size
R or Range is the difference between maximum and minimum of the readings within a subgroup i.e. it accounts for the variation within subgroup.
Thus Cp, Cpk account for within subgroup variation and do not consider subgroup drift in the data.
To find capability of processes considering within subgroup variation as well as subgroup drift, use the Pp, Ppk indices.
How do you measure process capability? What indices do you use?
Wednesday, April 28, 2010
Can Cpk be negative?
Yes, Cpk can be negative. Some quality folks find this hard to believe. In the real world when a negative Cpk appears most people try to check and recheck their calculations or the underlying data. But Cpk can be negative. Let’s try to prove it with 2 scenarios.
Cpk is calculated using the formula…

So we think about this formula, Cpk is the minimum distance of the process average from either specification limits.
Scenario 1
Consider a process as shown in figure 1. The process average is closest to the Lower Specification limit.
In this case, since process average is less than LSL, Cpk is negative.
The area of the histogram or distribution curve in red indicates parts that are below the Lower spec limit. All these parts are rejected.
Scenario 2
Consider another process as shown in figure 2. The process average is closest to the Upper Specification limit. In this case as process average is greater than USL, Cpk in this case is also negative.

The entire area under the distribution curve is red i.e. all parts are rejects as they are above the Upper spec limit.
What does a negative Cpk indicate?
As seen from the examples above, a negative Cpk indicates that the process average is outside the specification limits. Most of the readings are outside the specifications i.e. they are rejects.
Have you come across a negative Cpk? What did you think about it?
Cpk is calculated using the formula…
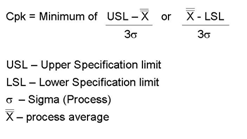
So we think about this formula, Cpk is the minimum distance of the process average from either specification limits.
Scenario 1

Consider a process as shown in figure 1. The process average is closest to the Lower Specification limit.
In this case, since process average is less than LSL, Cpk is negative.
The area of the histogram or distribution curve in red indicates parts that are below the Lower spec limit. All these parts are rejected.
Scenario 2
Consider another process as shown in figure 2. The process average is closest to the Upper Specification limit. In this case as process average is greater than USL, Cpk in this case is also negative.

The entire area under the distribution curve is red i.e. all parts are rejects as they are above the Upper spec limit.
What does a negative Cpk indicate?
As seen from the examples above, a negative Cpk indicates that the process average is outside the specification limits. Most of the readings are outside the specifications i.e. they are rejects.
Have you come across a negative Cpk? What did you think about it?
Monday, April 19, 2010
Measure Cpk only for stable processes
Cpk and other capability indices should be calculated for stable processes only. This is a critical requirement for calculating capability indices. Sadly, it is the most ignored fact in the real world.
What is a stable process?
A process that does not have any special causes present is a stable process. Such a process has inherent variation due to common causes only. The control chart for a stable process has no 'Out of control' points.
Why is stability important for Capability studies?
The capability indices are designed to determine how capable an ongoing process is for consistently delivering product within customer specifications given the natural variation of the process.
Ongoing processes should typically have only common cause variation i.e. the process is statistically stable.
When assignable causes come into play, the process becomes unstable. Now the control chart has out of control points that need to be watched closely and removed as soon as possible.
When processes are unstable, it is recommended to use performance indices like Pp and Ppk.
For more information on capability indices, please read our White Paper Use of different capability indices.
Wednesday, March 31, 2010
RFID for product safety and security
Traceability of food products plays a vital role in ensuring food safety and security. Tracking the food products throughout the supply chain is necessary.
Right from the ingredient suppliers through food manufacturing plants to the distribution and retail to the final consumer, food products need to be tracked.
Traceability improves reliablility and safety of food products. In the event of food related contanimation, the source of the problem has to be traced and tracked back to manufacturer or the ingredient suppliers in a small period of time.
RFID Or Radio Frequency Identification are used to track products throughout the supply chain. Using radio waves, these radio frequency (RF) tags help identify and track products. Just like any other product, RFID helps track food products too.
It offers higher security as products move through the supply chain.
ISO recently released a new standard ISO 17367:2009 for the use of RFID for supply chain applications. Using the RFID technology, the standard aims to provide higher level of product security worldwide enabling efficient exchange of goods in international trade. This standard can be applied in several industry sectors using RFID technology.
Monday, March 15, 2010
Role of Sigma in Cpk and Ppk calculations
Cpk and Ppk are calculated using the same formula.
So what’s the difference between the two?
The difference between Cpk and Ppk is the way sigma is estimated.
For Cpk, sigma is estimated using the formula…
Rbar/d2 for Xbar-R chart where Rbar is the average Range and d2 is a statistical constant
Sbar/c4 for Xbar-S chart where Sbar is the average standard deviation and c4 is a statistical constant
For Ppk, sigma is estimated using the formula

Where
X – Individual reading

- Process average
n – Sample size
So why use two separate indices?
Cpk and Ppk are designed for use under specific conditions.
Sigma used in the Cpk calculation explains inherent variation in the process which is caused by common causes. The control chart for such a process would be statistically stable.
On the other hand, sigma used in Ppk calculation explains the total variation caused by common as well as special causes. Control charts for this process would have points out of control i.e. the process is unstable.
New process design or pre production (pilot) runs for new products would typically have special and common causes present. Ppk is used for determining capability of such processes.
Saturday, February 20, 2010
Food Quality and Safety go hand in hand
The food and beverage industry has to deliver high quality product that satisfy the consumer needs like any other industry. In addition the food and beverage industry has to comply with the safety and regulatory requirements. Food safety and regulatory compliance are some of the key elements that food and beverage manufacturers track to prevent non compliance issues or recalls.
High quality of the food products in manufacturing plants usually results in high safety. Manufacturing plants that pay close attention to quality of the food products they make typically comply with the safety and regulatory requirements too.
Such plants will typically monitor the food products for regulatory compliance.
Regulatory checks like MAV or net weight/volume of the food products are monitored in real time. Actions are initiated as soon as violations are uncovered.
Let's think about it in using a simulation food plant X that makes ice cream.
Company X is operating at small rejection levels or high quality in production. They conduct the metal detection and other safety checks as part of their routine checks everyday.
Regulatory checks for MAV and net weight violations are tracked and controlled using automated systems.
Mistake proofing is in place using poka yoke devices. There are poka yokes that check box labels, match the box to the correct lid, check ingredients among many other checks.
Poka yoke devices themselves are regularly validated for accuracy.
Everyone in the plant considers quality and safety to be their responsibility.
Ice cream from this plant is high quality which is good for the company and safe for consumers which ultimately results in customer satisfaction.
Safe Quality food program from SQFI (Safe Quality Food Institute) is a food safety program. This program has different levels that start with basic food safety going through certified HACCP food safety plans finally requiring implementation of a comprehensive Quality Management System. Food safety is the primary focus of this program and quality being the secondary requirement. Even though food quality comes after safety, it plays an important role. Safe food products will usually have high quality in the manufacturing plants.
Wednesday, February 10, 2010
So much information, so little time!
Consumers shopping for food are busy and have very little time to read through all the information on food labels. Most consumers look for the best deal and quickly look at symbols before they purchase food products. Very few take the time to read nutrition facts or ingredient information on labels. Many consumers even misinterpret the symbols used on food products.
Food labels that use words like “organic”, “all natural” imply that the food is healthy. There is a lot of debate on the two terms natural and organic. Is natural the same as organic? Different? Is organic better than natural food? Does natural imply that there are no artificial ingredients or has minimum/no processing?
This leaves the poor consumer wondering how to make sense of these labels on food packages. Some even think if they made the right choice while shopping for food items. The consumer can always turn to the food and drug administration (FDA) for assistance.
FDA has provided food labeling guidelines and the requirements for claiming the food to be ‘healthy’ (please see N49 on this page).
Friday, January 22, 2010
Cp and Cpk are related. Really?
Process capability analysis plays an important role in quality. It helps determine whether the process is capable of consistently producing parts conforming to customer requirements. Cp and Cpk are the two most popular capability indices used to find process capability. Cp and Cpk are related to each other. Whenever I say this most people around me are surprised, some think I am insane. But it is true. Cp and Cpk are related by the equation. Refer to chapter 6 in the NIST/SEMATECH e-handbook of Statistics Handbook
Cpk = (1-k) Cp
where k is the distance between the process mean and the midpoint of specification range.

where
m = midpoint of the specification range or tolerance
mu = process mean
USL and LSL – upper and lower specification limits.
k has a value between 0 and 1.
When k is 0, Cpk is equal to Cp.
When k is less than 1, Cpk < Cp
That is why Cpk ≤ Cp.
Thursday, January 14, 2010
Data versus Facts
Taiichi Ohno said "Data is of course important in manufacturing, but I place the greatest emphasis on facts".
Ohno believed that data served as mere indicators of what's going on in the process.
Actually verifying on the scene facts of the situation is key to knowing exactly what's happening.
The Ohno circle requires people to stand in the circle drawn on the floor of a plant for hours to observe the process. This helps the person to gather facts first hand, thoroughly understand the actual situation, then evaluate and analyze what's going on. This is "Go and See the actual situation for yourself" principle practised at Toyota.
At Toyota, nothing is taken for granted. What one sees in person first hand may never show up in reports.
Data in reports may measure results however, it misses out to reveal the details of the actual process that is being followed on a daily basis.
Data can be manipulated, but facts remain hard facts!
Subscribe to:
Posts (Atom)